Free data visualization tools have become increasingly popular among businesses and organizations looking to make better sense of their data. These tools are designed to help users create interactive and informative visualizations that can be used to identify patterns, trends, and insights in complex datasets. One of the biggest advantages of open source data visualization tools is that they are free to use and can be customized according to the needs of the user.
Data visualizations are becoming a very powerful vehicle for delivering messages besides of the aesthetics improvements. Translating all the numbers and data into a coherent and graphical display could show the overwhelming comparison between what we are paying and the kind of service we receive, then I could show it to my friends, tweet it or digg it for people to see it.
Why now data visualizations are more powerful than ever?
Technology, social media (blogs, twitter, facebook etc..), the creation of softwares like flash or processing to create very cool and compelling visualizations, however the most important thing is data, the data which people has access today it’s thousands of times more useful than the one available in the past.
Many governments are making APIS to open their data to people, The The New York Times for example, has opened their archives to public domain, all this information and numbers can now be organized and displayed on interactive tools to talk about a specific subject and make it relevant and understandable to people. Some examples could be the cost of getting sick which is a tool to gain a deeper understanding of health care costs.
The visualization must communicate a situation that is having an impact and warrants a thoughtful decision. The visualization has to show some kind of movement.
Open Source or Free Data Visualization Tools
A caveat: Daniel Harris at Software Advice said it best: “‘open source’ is not a synonym for ‘free,’ ‘easy,’ or ‘DIY.’” The “source” in open source is “source code,” so if you can’t code, i.e. write computer programs, the “open” part is sort of moot.
There are some tools, like Tableau Public, BIRT, and Pentaho that do data visualization (and more), but they are more business intelligence software. You can find more information about that here Top 8 Free and Open Source Business Intelligence Software post.
Free data visualization software
The insights derived from data visualization can help decision-makers make informed decisions, identify trends, and communicate effectively with stakeholders. However, not all businesses have the resources to invest in expensive data visualization tools. Fortunately, there are many free data visualization tools available that can help businesses visualize their data without breaking the bank.
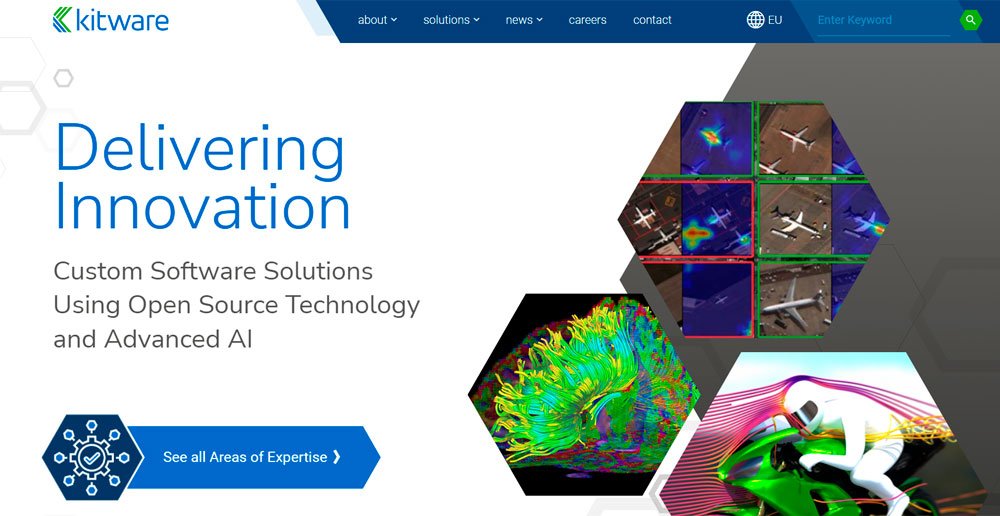
Candela
Candela is part of Kitware’s Resonant data and analytics platform. Jeffrey Baumes, Kitware’s Assistant Director of Scientific Computing, describes what makes Candela unique: “Candela interfaces to several of the more cutting edge data visualization tools and normalizes them with a common API, so you don’t need to learn many different coding styles for each library.”
You will, however, need to know Javascript, as that’s the language used in Candela’s library. Candela use is made easier by its companion application Resonant Lab. That interface is “just a web application,” says Baumes. Users can “basically point and click to connect their data to the visualization.” This is a great library and it is first on our list with free data visualization tools.
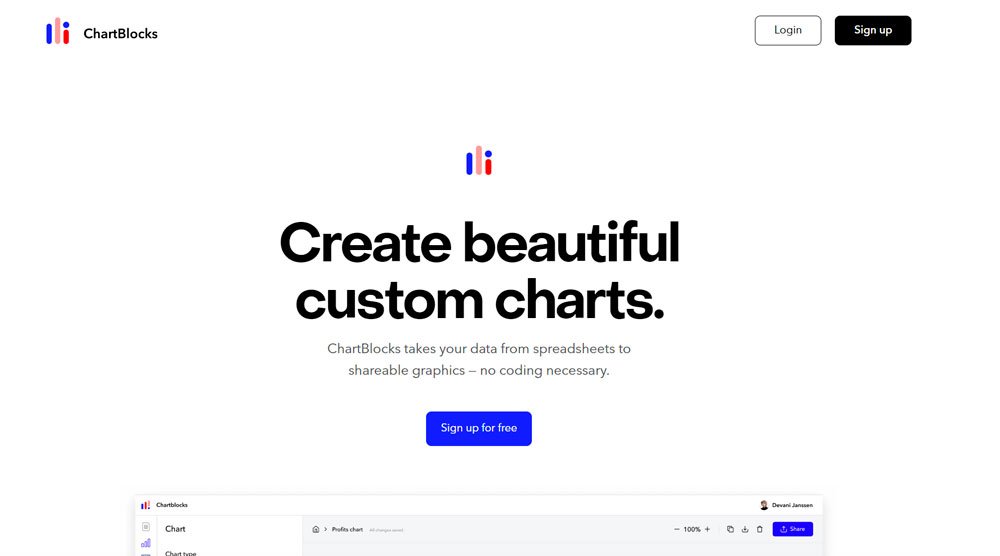
Chartblocks
Chartblocks, like a lot of these free programs, basically does the same thing that made Windows so successful: replace the code with a visual interface so anyone can use it. In Chartblocks’ case, that visual interface is their chart designer, which guides you through the process.
With their free version, you can make up to 30 charts, export the charts as .png files (no vector graphics in this version), and get up to 5,000 monthly views. You can’t make your charts private with this, though, so don’t go charting your favorite passwords, or your friends’ social security numbers. Though that last one might not get you in trouble, so it’s your call.

Datawrapper
Datawrapper offers a range of pay versions, but if you’re reading this, you’re probably more interested in their free option. The free version’s good for one user, but don’t let that stop you from considering Datawrapper. if you’ve got a small business, or are just looking to supplement a presentation or report, this could be a viable option.
It is, however, only good for 10,000 views per chart, so if you’re dealing with more customers, you’ll want to consider upgrading to a paid version. Datawrapper’s also optimized for mobile devices. Given that “56 percent of consumer traffic to the leading US websites is now from mobile devices,” that’s a big positive for Datawrapper.

Raw
Raw’s biggest benefit may be how idiot-proof it is. The interface is easy to pick up. You drag and drop, then click on the kind of visualization you want to make from a chart. Among these free data visualization tools, Raw may win the “best user interface” award for how easy they make it to choose a chart and turn your data into a visual.
A few heads-ups: Be sure your spreadsheet has a row with category names at the top, and make sure your data doesn’t have any merged cells or nested tables. Also, all data on Silk is publicly visible, so don’t share anything confidential.
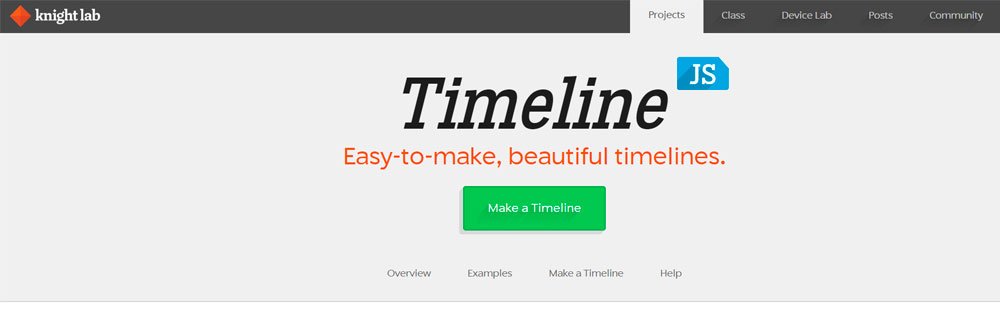
Timeline
Timelines are to history what directions are on maps: they show how one thing led to another. Timelines can also be a great way to enliven reports, especially when a tool like Timeline allows you to design and embed them for free. If you’ve got a Google Drive account, just make a Google Spreadsheet using a template Timeline provides, embed it on your website, and you’ve got something as slick as this article’s timeline on the spread of ISIS (you’ll have to scroll down a bit), which was made with this tool.
Open Source Data Visualization Software
Chartist.js
Come for the animations, stay for the free data visualization. If you’re looking to get started, fast (as in, you’re reading this article because you need to make a chart by close of business today), Chartist recommends you “get things up and running by using the Chartist.js CSS files.”
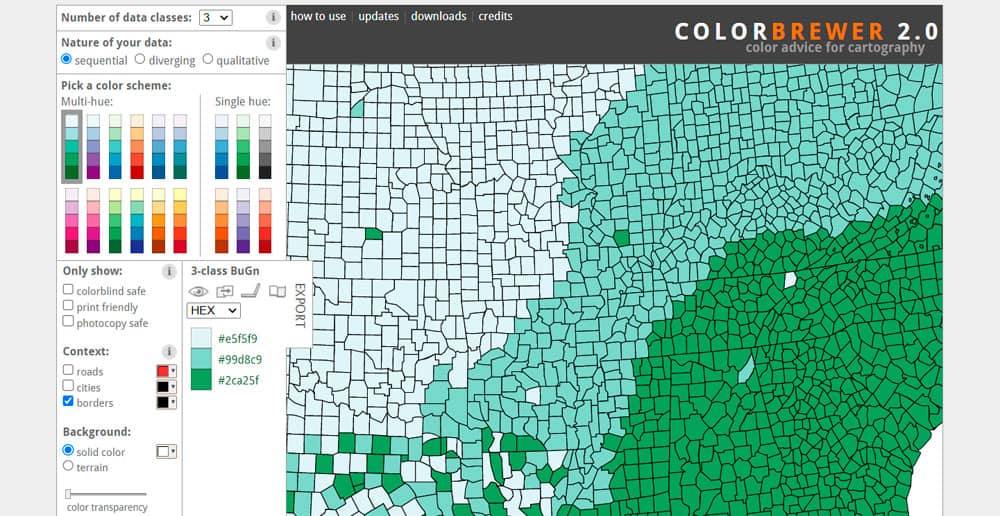
ColorBrewer
If you’re making a map and want the colors to pop, ColorBrewer’s a good choice. ColorBrewer has 35 basic color schemes for any map you may be making. The schemes are designed so that the colors don’t look too similar. Though ColorBrewer isn’t mapping software itself, it will make your maps look better.
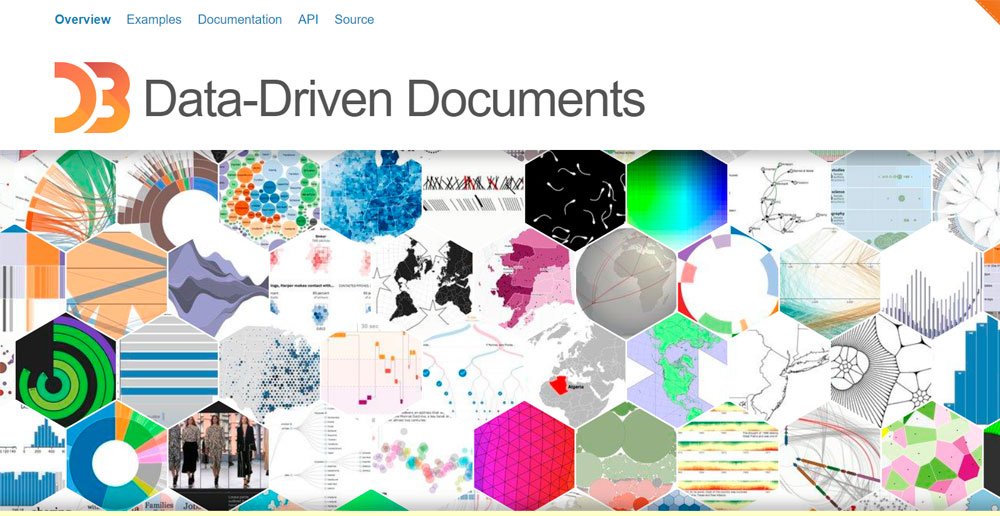
D3.JS
If you know javascript, and you want to create images, the D3.JS library will make you happier than a six-year-old with one of those real-ish lightsabers. D3.JS is one of the major javascript data visualization libraries, and it’s used by some big-name players, including The New York Times and Datameer.
Google Charts
Google Charts can be your company’s data oompa-loompas. How impressive is their range of visualizations? They’ve got Sankey diagrams. I’ve been reading about free data visualization tools for several days now, and have yet to have seen that term. That’s like an oompa-loompa who can do your taxes while he sings about “accidental” borderline child murder.
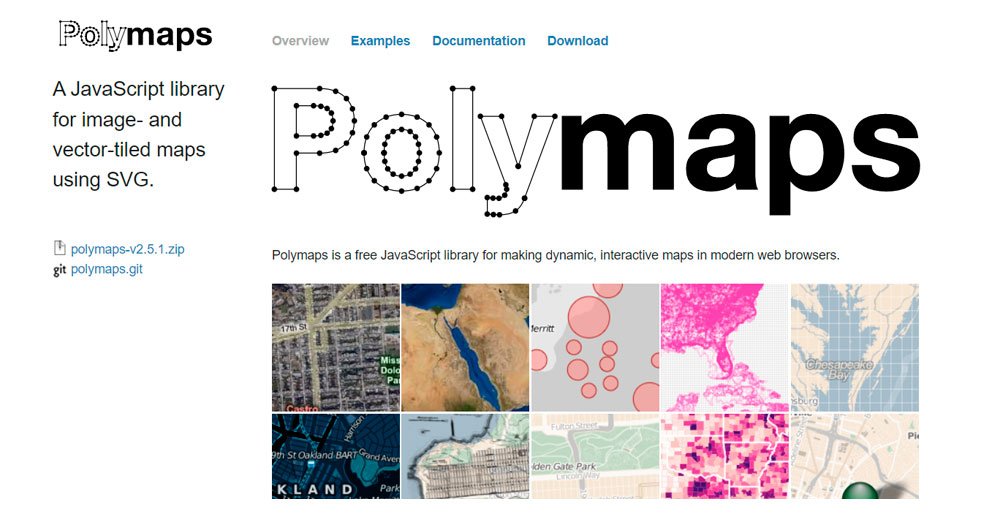
Polymaps
Polymaps is a javascript library that provides you with the tools to create interactive maps. Polymaps uses scalable vector graphics (SVG), and the results you can get are impressive: this example uses k-clustering to depict crime in Oakland, CA.
Some places to look up for interesting projects of data visualization. visualcomplexity.com aaronkoblin.com bewitched.com hint.fm
In conclusion, open source and free data visualization tools are a great way to present complex data in an attractive, understandable way. Open source tools are generally cheaper than proprietary systems and developers can customize them to fit the user’s specific needs. In addition, the availability of free community support makes it easier for people to troubleshoot any technical issues. However, it’s important to assess the features of different open source tools to determine which one is most suited for your visualization project.